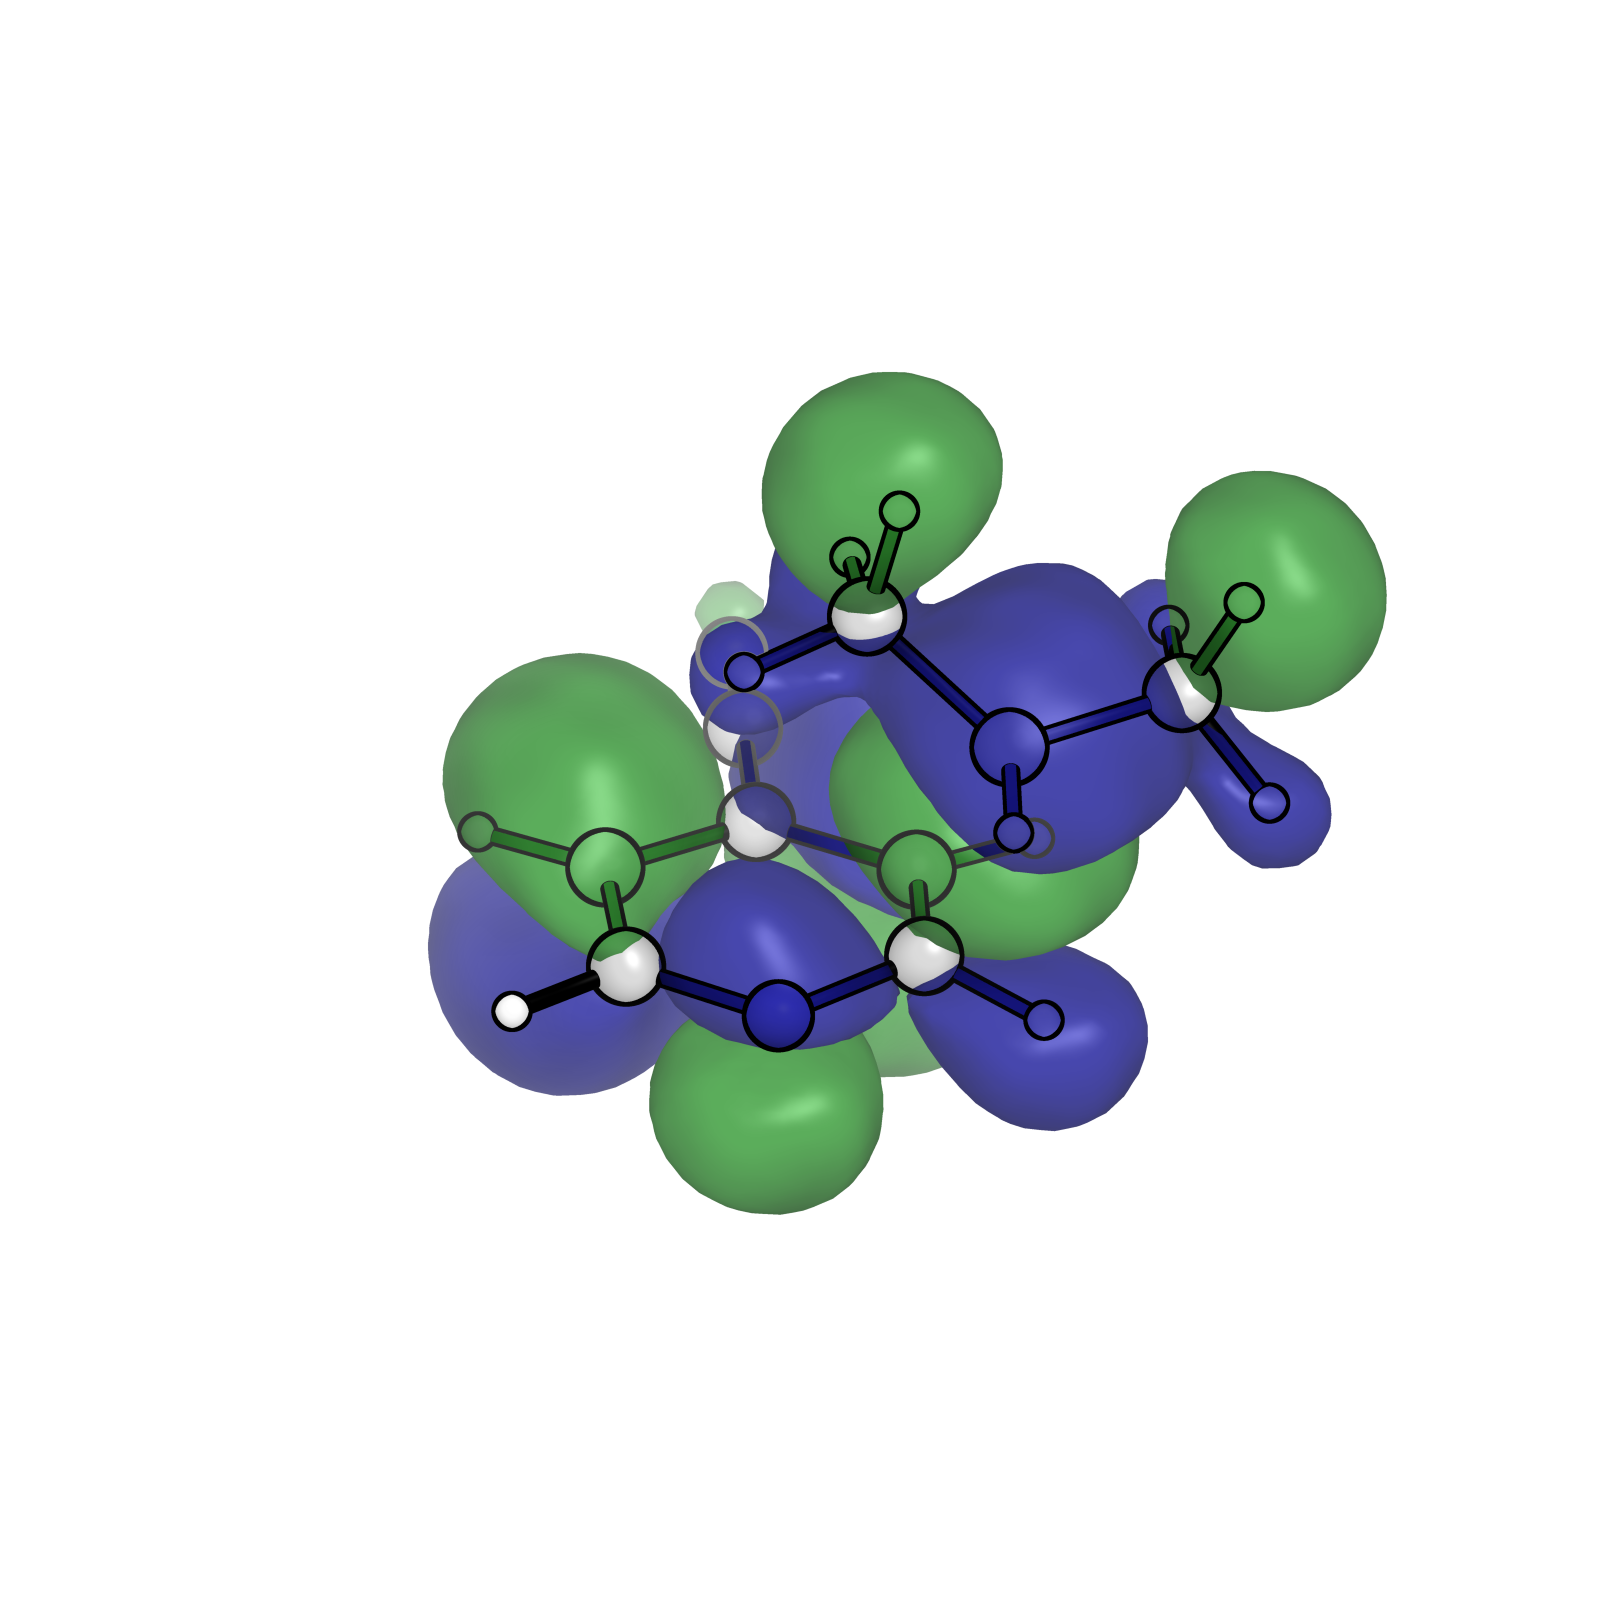
PyMol Orbital Visualization
Notes for a Houk Group style molecular orbital visualization in PyMol
Gaussian .fchk to .cube
for i in {27,28,29};do cubegen 0 MO=$i {Name}.fchk {Name}-$i.cub -2 h;done |
In PyMol
Build Isosurface
isosurface {desired-isosurface-name}-n, {filename.cube}, -0.02 |
Transparency
set transparency, 0.2 |
From 0 to 1
Color Surface
Let’s go Houkie style
set surface_color, density, *n |
Other Visualization Settings for structures
From Cooper
set valence, 0 |
For changing for sele or specific objects only (with global settings removed)
set valence, 0, sele |
Combining Transparent Objects in Ray Trace
Use Setting->Transparency->Multi-layer
ref